

Once Again, Administration on Aging Misses the Statistical Boat
By throwing all those 65 and over into the same bucket

While the Administration on Aging’s recently-released 2023 Profile of Older Americans provides a myriad of interesting statistics about older people in the United States, by putting all people 65 and over in the same bucket it obfuscates important population trends. This is because the health and life experiences of those between the ages of 65 and 84 are by and large very different from those 85 and over. In fact, those in the first group may well be the children of those in the second (which is my case — I’m 68 and my mother is 90).

Interesting Data
That said, here’s some of the data contained in the report:
There were 57.8 million Americans aged 65 and older in 2022, representing 17.3 percent of the total United States population.
Of these, 31.9 million were women and 25.9 were men, older women outnumbering men by 123 to 100. By age 85, there are 184 women for every 100 men.
Those who reach age 65 have an average life expectancy of 18.9 years, 20.2 for women and 17.5 for men.
There were 88,988 centenarians in the United States in 2022, just 0.15 percent of those over age 65.
By 2040, the 65 and over population is expected to grow to 78.3 million people, a 35 percent increase over the number today (and more than twice as many as the 35 million in 2000).
Also by 2040, the number of those 85 and over is projected to be 13.7 million, a 111 percent increase over the 6.5 million in the United States today.
In 2023, 19.2 percent of Americans 65 and above were either working or looking for work. This compares to 63.1 percent in 1900, 45.8 percent in 1950, and 15.8 percent in 1985. The more recent upswing is largely due to more women entering and staying in the workforce.
The report also provides projections for the overall size of the 65 and older population in 2060, estimating that it will reach 88.8 million people, 13.4 percent more than the 2040 number, a significant slowdown in the rate of growth between now and 2040. This is because the youngest baby boomers will reach age 65 in 2029. In fact, most of the growth in the 65 and over population has already occurred, the number growing almost 60 percent between 2000 and 2020.
Missing Data
Unfortunately, the report provides no projections for the 85 and over population for 2060. It’s almost certain to keep growing at a fast rate after 2040 since the youngest baby boomers won’t reach age 85 until 2049. These numbers may be easier to take in with the following chart:
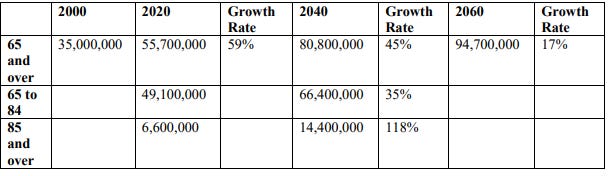
As you can see, important information is missing. But the chart shows that the growth rate of the 65 and over population is actually decreasing. And will continue to decrease in the future.
Ten-year increments rather than 20-year ones would also be useful, since by 2030 all surviving baby boomers will be 65 and over and by 2050 they’ll all be 85 and over. As a result, the need for elder care is likely to triple between now and 2050 when it peaks.
Filling in the Gaps
Fortunately, I was able to find some of this missing information in another Census Bureau report, from which I created the following chart (in millions):

I find these numbers much more revealing about future trends. They show that the growth of the 65 to 84 population will essentially stop after 2030, when the youngest baby boomers will be 66, but that the 85 and over population will continue to grow at a fast clip through 2050, after which it will plateau. This makes sense since by 2050 all surviving baby boomers will be 85 or older, the oldest being 104 and the youngest 86. By 2060, the youngest baby boomers will be 96.
In terms of coming elder care needs, we’ve already begun three decades of rapidly increasing need with the greatest increase happening between 2030 and 2040 when the 85 and over cohort will grow 58 percent.
Great article. Addressing the needs of older adults is crucial, and writing articles are a powerful tool to raise awareness. We need to move from awareness to action, sooner vs. later.