

The Shrinking of Japan: A Harbinger of What Will Happen to the U.S.?
Perhaps if we cut off immigration

The graphic below from Visual Capitalist of the oldest societies in the world is both striking and somewhat misleading. Monaco is far older than any other country, no doubt because you have to be old and rich to afford to live there. Many of the other places that make the list are tropical island retirement paradises, including two French territories in the Caribbean, Martinique and Guadeloupe. as well as the U.S. Virgin Islands.
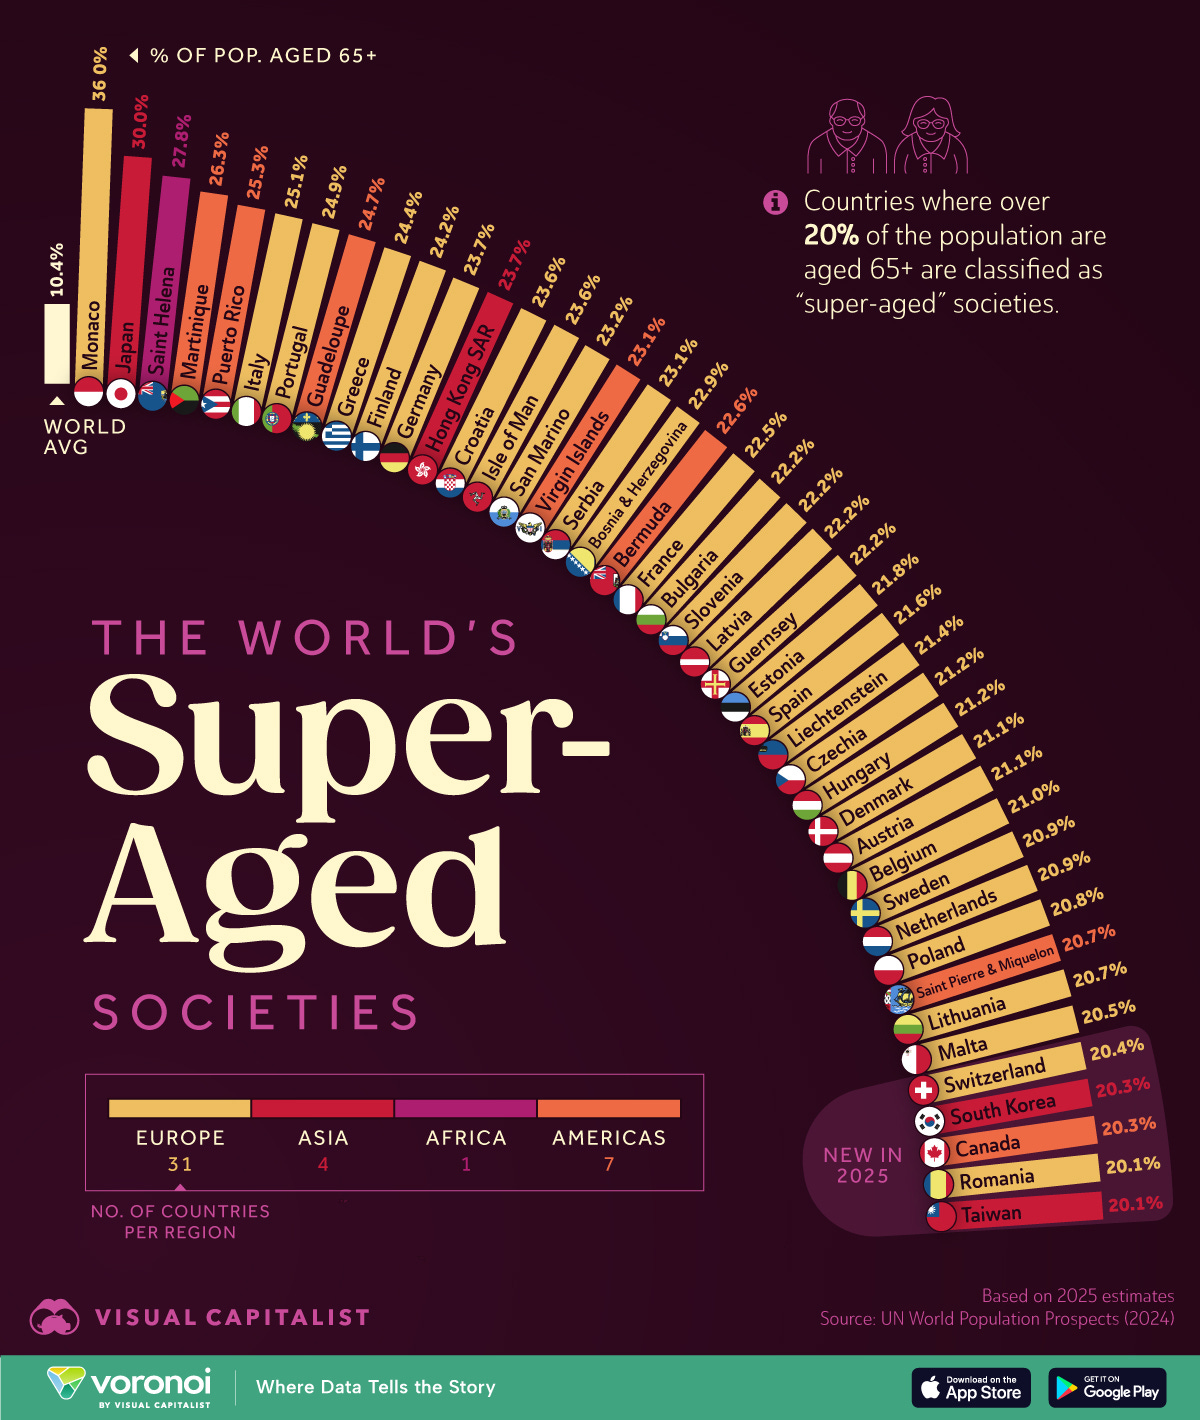
More striking is Japan with 30% of the population now aged 65 and above. The closest large countries that follow are Italy and Portugal, both with 25% of their residents aged 65 and older. Most other European countries, as well as South Korea and Taiwan, follow in the lower 20% range.
Despite the great number of baby boomers passing the age-65 threshold every day, the United States is younger with 18% being in this age category. This is probably due to large number of immigrants in the country who tend to be younger than the population at large. They make up 15.6% of the U.S. population as compared to 2.8% in Japan, 9% in Italy and 10% in Portugal.
Comparing Japan and the United States
It’s worth taking a look at Japan’s demographics since they could paint a picture of what we and other developed nations will face in coming years. Their population today totals 124 million with a median age of 49.4 years as compared to 345 million and 38.3 years in the United States. The Japanese population declined 0.5% from 2023 to 2024 while the US population grew by 0.57%. (For purposes of reference, the median age in the United States was just 26.7 years in 1970.)
Japan has a fertility rate of just 1.2 births per woman. The fertility rate in the United States is 1.6 births per woman, still well below the replacement rate of 2.1 million. Combined with the relatively small number of women of childbearing age in Japan this means that its population decline is likely to accelerate in coming years. Japan has a birthrate of 7 births per 1,000 people as compared to 11 in the United States, a significant decline from 16.7 in 1990.
One reason that Japan is so much older than the United States is that the Japanese live longer. They have an average life expectancy of 84.9 years as compared with 79.5 years for babies born in the U.S. today. (All these statistics are from Worldometer.)
It’s worth comparing the population pyramids for the two nations.
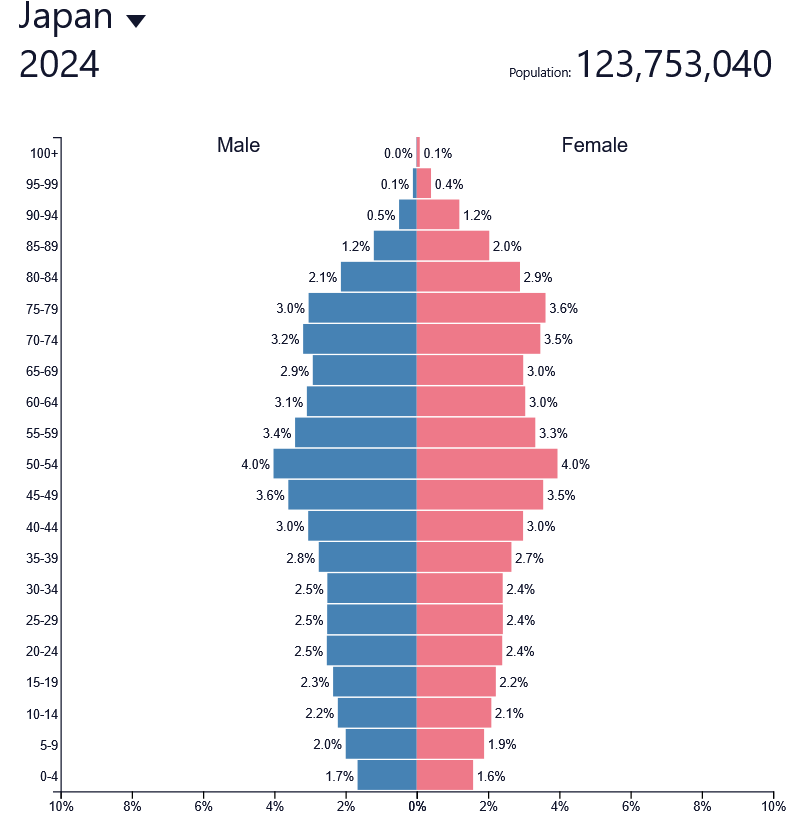

It’s evident that Japan’s population is much more top heavy than that of the United States. Just comparing a few ages between the two countries, 2.3% of Japanese are 90 or older as compared to 0.6% of Americans. And while just 16% of Japanese are under age 20, 23.9% of Americans are in this younger cohort. The U.S. pyramid is also much more uniform than Japan’s with all five-year age groups from birth to 70 making up from 5.3% to 7.0% of the total population. By contrast, the Japanese age groups range from 3.3% to 8.0% from birth to age age 85. Japan has a strange bulge in the pyramid for those aged 50 to 54. As a result, they will see a big drop off in the working age population beginning in about a decade as this group reaches its 60s.
Many fear a demographic collapse in Japan if current trends continue. According to one commentator: “The Japanese government projects that, if this trend is not reversed, the country’s current 125 million inhabitants will drop to 100 million around 2050. The population is expected to fall even lower - to less than 60 million - by the end of the century. The demographic downward curve is so steep that it threatens the strength of the country’s economic future. As a result, there are questions about Japan’s ability to sustain the burden of pensions and care for the elderly, or to have a healthy workforce made up of young people with sufficient innovative industrial capacity to grow the economy. Furthermore, some 500 schools are closing every year.”
What About the United States?
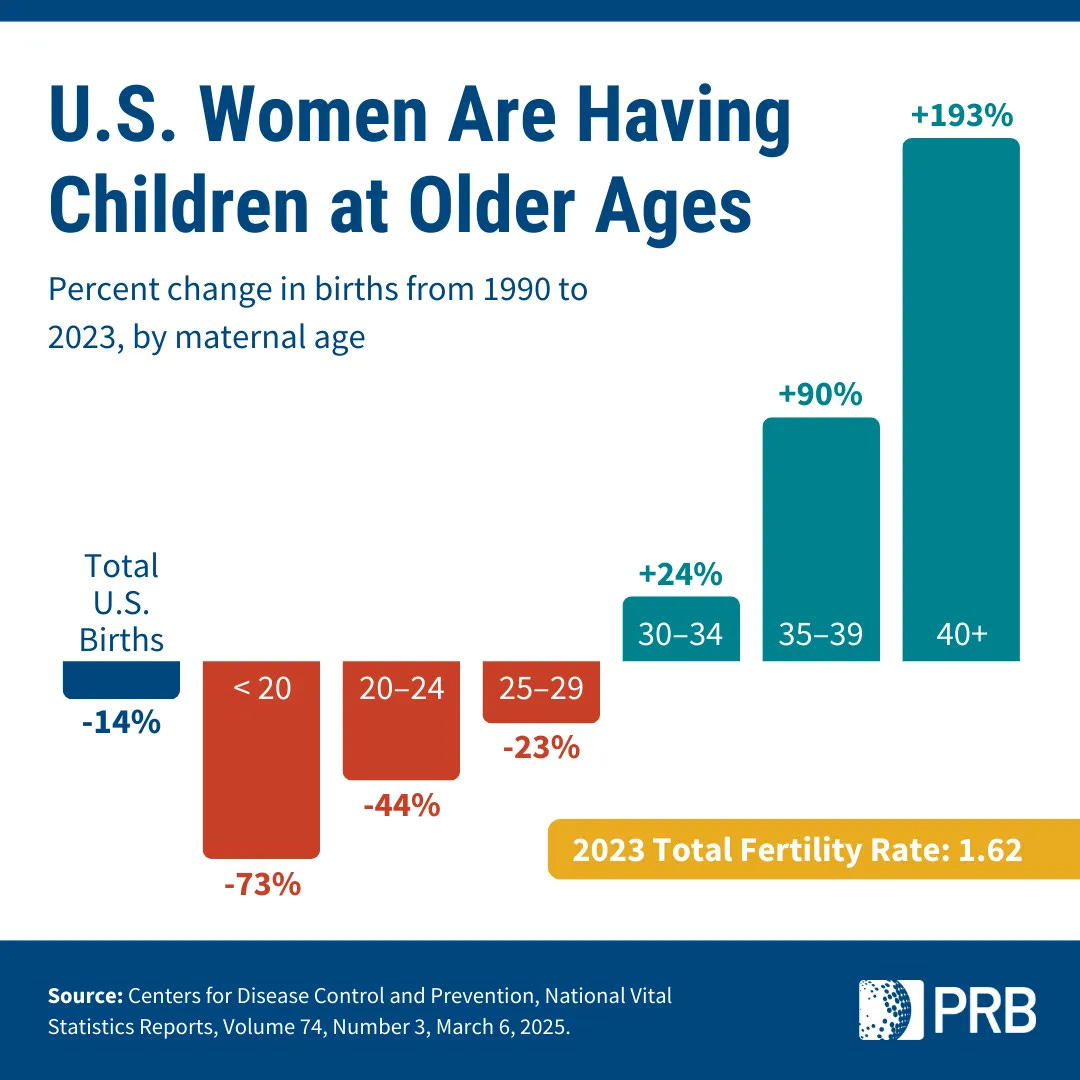
In the United States, the fertility rate in 2023 dropped to from 1.66 the prior two years. Just under 3.6 million babies were born that year, 562,195 fewer than in 1990 when the entire US population was 28% smaller, 250 million as compared to 345 million today.
The good news is that there are many fewer teen births than in prior years, the rate dropping 78% from 1990 to today. Teens in 2023 had 390,000 fewer births than in 1990. During the same period, the number of births to women over 40 have tripled, though that still does not amount to the bulk of new babies, just 147,000, or about 4% of all births. (Source: Effects of Age-specific Fertility Trends on Overall Fertility Trends: United States, 1990–2023, National Vital Statistics Report, March 6, 2025.)
According to Jennifer D. Sciubba, President of the Population Reference Bureau, we may see the number of births increase somewhat in coming years because “the youngest Millennial women are now 29 years old, so prime reproductive years. As a group, Millennials are much larger than the Gen X women now exiting their reproductive years, so that means more potential mothers.” In other words, while Japan faces a lower number of births due in part to its low number of women of childbearing years, the relatively higher number of Millennial women in the United States should boost the number of babies born here to some extent.
Keep the Immigrants Coming
Still, our rather cylindrical population pyramid will mean a greater dependency ratio — the number of retirees as compared to people in the workforce — in coming years. It will be exacerbated if we limit immigration. According to the US Census Bureau, our population growth from 2023 to 2024 was driven by immigration. Net immigration accounted for 84% of last year’s population increase of 3.3 million, though births did outnumber deaths by about half a million. (One wonders whether the relatively low number of deaths was in part due to the fact that so many older Americans had already died during the Covid-19 pandemic).
So, what happens if we cut off the immigration spigot? The Census Bureau runs population projections based on various assumptions about levels of immigration. Their middle projection foresees the US population reaching a peak of 370 million residents in 2080 and then declining slightly to 366 million by 2100. It projects that with high levels of immigration the total population could reach 435 million by 2100, but that a low-immigration scenario would lead to our population peaking at 346 million in 2043 and then declining to 319 million by 2100. Even this is not quite as bad as the likely population decline in Japan, but given the relative youth and higher birthrates of immigrants it would mean a much older society with its dependency ratio and elder care challenges.
Elon Musk has suggested that the solution is for everyone to have more children, or at least for those who live in developed nations to follow his example. He has 12 children so far. But that appears to buck the trend of women having fewer children as they gain education and financial stability.
Given that the population of most African countries and India continues to grow at great rates, and many parts of the world are suffering from the effects of climate change, wouldn’t it be a lot easier to simply keep the flow of immigrants coming? They certainly contribute a lot to the country. Musk himself is one example.